


Learn which website analytics metrics matter, how to avoid misleading reports, and when to use GA4, Search Console, Hotjar, Matomo, Clarity, privacy-focused platforms, and server logs.
Website analytics is the practice of collecting, measuring, and interpreting data about how people discover and use a website. A useful analytics system answers business questions: which channels attract qualified visitors, which landing pages support a goal, where users encounter friction, and whether a change improved revenue, leads, retention, or another meaningful outcome.
Traffic volume by itself is not success. A campaign can increase visits while lowering lead quality, and a smaller audience can create more value when its intent matches the offer. This guide explains the most important website statistics, common reporting mistakes, and the tools that provide first-party, search, behavioral, competitive, and server-level evidence.
What is website analytics?
Website analytics combines a measurement plan, tracking implementation, reporting, and interpretation. The measurement plan defines the decisions the organization needs to make. Tracking records relevant events and dimensions. Reports summarize performance, while analysis explains likely causes and recommends action.
No single tool sees the entire customer journey. Browser consent, ad blockers, cross-device behavior, attribution rules, data thresholds, time zones, and implementation errors all create differences. Reliable analysis uses documented definitions and more than one source when the decision is important.

Why website statistics matter
Analytics replaces assumptions with evidence. Content teams can see which landing pages attract search demand. Marketing teams can compare channels by cost and conversion. Product teams can locate friction in forms and journeys. Technical teams can detect broken pages, slow templates, and tracking failures.
The purpose is not to watch dashboards continuously. Establish a regular review rhythm, alert on critical failures, and investigate when a meaningful metric changes. Daily checks suit campaign launches and outages; weekly or monthly comparisons are better for stable trends.
Key website analytics metrics
Users, sessions, and views
A user is a distinct measured visitor within the limits of the analytics implementation. A session is a period of activity, and a view is a page or screen display. One user can return for several sessions and generate many views. Report these separately so growth in repeated page loads is not mistaken for growth in audience.
Landing pages
A landing page is the first page viewed in a session. Compare landing pages by qualified users, engagement, key events, and conversion rate. This reveals whether search results, ads, referrals, and social posts send visitors to a page that matches their expectation.
Channels, source, medium, and campaigns
Channel groupings summarize acquisition such as organic search, paid search, referral, email, social, and direct. Source and medium provide more detail, while UTM parameters identify campaigns. Use a consistent naming convention; otherwise the same campaign becomes several rows and comparisons become unreliable.

Engagement and bounce rate
In Google Analytics 4, an engaged session lasts longer than 10 seconds, includes a key event, or contains at least two page or screen views. Engagement rate is the share of engaged sessions; bounce rate is the opposite. Interpret these metrics by page purpose. A short visit can still be successful when a page gives a quick answer or phone number.

Events, key events, and conversion rate
Events represent actions such as viewing a page, submitting a form, adding a product, downloading a file, or completing a purchase. Mark only meaningful outcomes as key events. Conversion rate should use a documented denominator—users or sessions—so reports remain comparable.
Revenue, lead quality, and customer value
Connect analytics with ecommerce or CRM outcomes when possible. Revenue per user, qualified-lead rate, cost per acquisition, repeat purchase, and customer lifetime value usually matter more than raw clicks. Protect personal information and send only data that the platform and your policies permit.
Click-through rate
CTR is clicks divided by impressions, multiplied by 100. In Search Console it describes clicks from Google Search results; in advertising it describes clicks on an ad. Always name the context because identical labels can use different data sources.
Technical performance and errors
Monitor page speed, Core Web Vitals, status codes, JavaScript errors, failed forms, and tracking health. A marketing decline may be caused by a broken checkout or missing tag, not by weaker demand. Annotate deployments so changes can be connected to the correct time period.

How to build a reliable measurement plan
1. Start with decisions, not dashboards
List the decisions each team must make and the evidence required. A content team may need to prioritize declining organic pages; an ecommerce team may need to identify checkout friction. Remove vanity metrics that do not change an action.
2. Define every KPI
Document the metric name, calculation, data source, owner, reporting frequency, and segmentation. Decide what counts as a qualified lead, successful purchase, engaged visit, and campaign conversion before comparing teams or periods.
3. Design and test tracking
Create an event and parameter specification, implement tags once, and validate them across devices, consent states, domains, and payment flows. Exclude internal or test traffic where appropriate. Check that key events do not fire twice and revenue values include the correct currency.
4. Protect privacy and data quality
Collect only what is necessary, configure consent and retention, restrict access, and avoid sending personally identifiable information to tools that prohibit it. Document filters and exclusions. A smaller trustworthy dataset is more useful than a large dataset with unclear consent or duplicated events.
5. Compare suitable periods and segments
Account for weekends, seasonality, campaigns, and product launches. Compare equivalent periods and segment by landing page, channel, device, country, and new versus returning users when relevant. Large site-wide averages can hide a serious problem in one template.
10 useful website analytics tools

1. Google Analytics 4
GA4 collects event-based data from websites and apps. Its reports cover acquisition, engagement, pages and screens, monetization, retention, user attributes, and technology. Realtime helps validate new activity, while Explorations support funnels, paths, cohorts, and custom analysis.
Configure business-specific events and key events instead of relying only on automatic collection. Review attribution and consent settings, and connect ecommerce or advertising data only when it supports a clear measurement need.
2. Google Search Console
Search Console reports Google Search clicks, impressions, CTR, average position, queries, pages, countries, devices, and search appearances. It also covers indexing, sitemaps, Core Web Vitals, links, enhancements, manual actions, and security issues. Use it for search visibility; use analytics for onsite behavior and outcomes.
3. Hotjar
Hotjar adds heatmaps, session recordings, funnels, trends, and surveys. It is useful for investigating why users struggle with a page or journey. Filter sessions around a defined question, protect sensitive data, and validate recommendations with outcome metrics or experiments.
4. Microsoft Clarity
Clarity provides behavior-oriented features such as session recordings and heatmaps. It can complement analytics when teams need visual evidence of interaction patterns. As with any recording tool, review consent, masking, access, and data-governance requirements before deployment.
5. Matomo
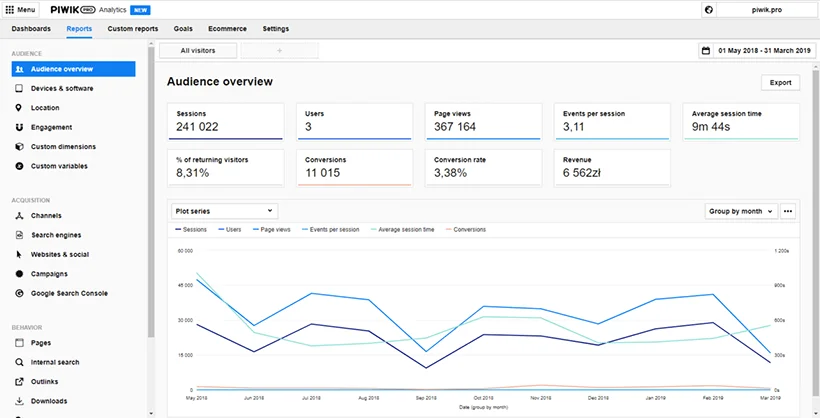
Matomo, formerly known as Piwik, is available in cloud and self-hosted forms. It appeals to organizations that want more control over analytics infrastructure and data. Self-hosting also creates operational responsibilities for security, updates, storage, backups, and performance.
6. Plausible or Fathom
Privacy-focused analytics platforms such as Plausible and Fathom offer simpler traffic and goal reporting with fewer dimensions than enterprise suites. They can suit teams that value a lightweight interface and limited data collection. Compare hosting, consent, retention, ownership, and integration requirements before choosing.
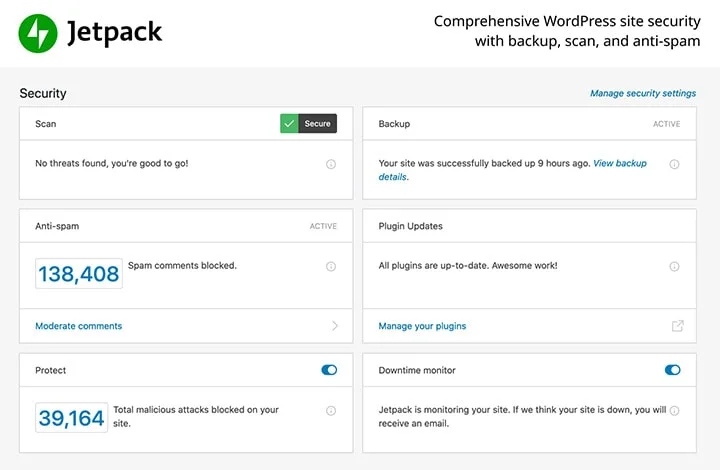
7. Jetpack Stats
Jetpack Stats provides straightforward traffic reporting inside WordPress. It may be convenient for publishers who need page, referrer, and visitor trends without a complex reporting setup. Evaluate its features and performance impact against the rest of the Jetpack modules you actually use.
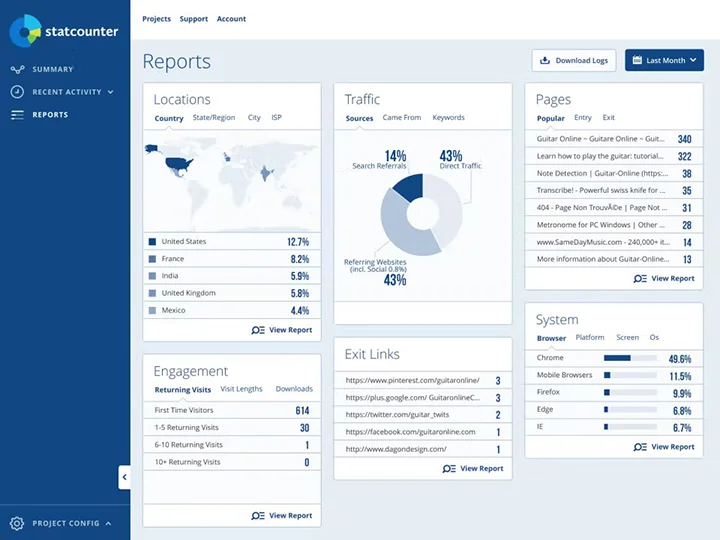
8. Statcounter
Statcounter offers website traffic and visitor analysis with a long product history. Plan limits and features can change, so verify the current offering rather than relying on an old free-visit allowance. It is an alternative worth comparing when a team wants a simpler visitor-oriented interface.
9. Server logs and AWStats
Server logs record requests handled by the server, including bots and resources that browser analytics may not measure. AWStats can summarize log data on many hosting environments. Logs are particularly useful for crawl analysis, outages, status codes, and bandwidth, but they require careful storage, privacy controls, and interpretation.
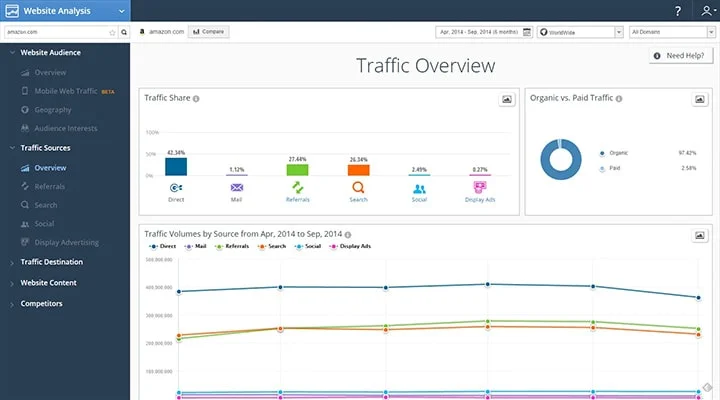
10. Ahrefs, Semrush, and Similarweb
These third-party platforms estimate search visibility, keywords, backlinks, and competitor traffic using their own crawls and data models. They are useful for discovery and directional comparisons, not as exact copies of a competitor’s first-party analytics. Validate decisions with your own Search Console and analytics data.
Where older analytics and feedback tools fit
Older lists often include products such as GoingUp, AuthorityLabs, Quantcast, iPerceptions, Open Web Analytics, and other specialist services. Some remain available, some have changed focus, and some may no longer match the original description. Check current documentation, pricing, ownership, support, and privacy terms before installation.
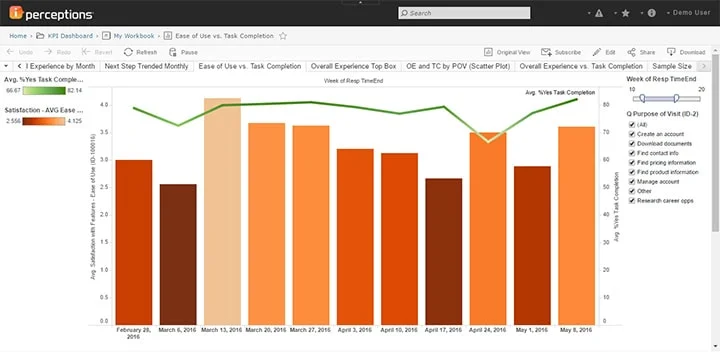
Survey and voice-of-customer tools can reveal why users visited and whether they completed their task. They answer questions that clickstream reports cannot. Open-source platforms can offer flexibility, but self-hosting does not remove the need for consent, security, retention rules, and maintenance.
Common website statistics mistakes
- Treating all visits as equally valuable.
- Calling traffic volume a direct Google ranking factor.
- Using the wrong CTR formula; CTR is clicks divided by impressions.
- Assuming a bounce always means dissatisfaction.
- Comparing tools without aligning date, time zone, filters, and definitions.
- Reporting competitor estimates as exact traffic.
- Installing several tags that duplicate events and slow pages.
- Collecting personal data without a clear need and lawful process.
- Changing a page without recording the change or measurement plan.
A practical weekly analytics workflow
First confirm that tracking and key events are working. Review acquisition and landing-page changes, then investigate important conversion, engagement, or revenue movements. Segment unusual results by device, source, country, and page. Check Search Console for organic-search changes and technical reports for errors.
Turn each finding into a decision: fix a tracking problem, improve a landing page, adjust campaign targeting, test a clearer CTA, or leave a healthy trend alone. Record the owner and expected outcome, then revisit the same metric after enough data has accumulated.
Final takeaway
Good website analytics is not the largest dashboard or the highest traffic number. It is a trustworthy measurement system that connects acquisition, behavior, technical quality, and business outcomes. Choose the smallest set of tools that answers your decisions, protect user data, document definitions, and turn each report into a testable action.
Frequently Asked Questions
Quick answers to common questions about website analytics
Website analytics is the collection, measurement, and interpretation of website data to understand acquisition, behavior, technical performance, and business outcomes. A useful analytics system connects each metric to a decision rather than reporting traffic alone.
A user is a distinct measured visitor, a session is a period of activity, and a view is a page or screen display. One user can have several sessions and generate many views, so the metrics answer different questions.
Start with qualified users, landing pages, channel or source, engagement, key events or conversions, conversion rate, revenue or lead quality, and technical performance. The right set depends on the website’s business objective.
Third-party tools can estimate competitor traffic and search visibility, but they do not have the competitor’s complete first-party analytics. Use estimates for directional comparisons and research, not as exact visitor or revenue totals.
Traffic volume alone is not a guaranteed ranking factor. SEO growth depends on factors such as crawlability, indexing, relevance, content quality, links, and user experience. Measure whether traffic is qualified and produces useful outcomes instead of chasing visits alone.




Comments
Leave a Comment