


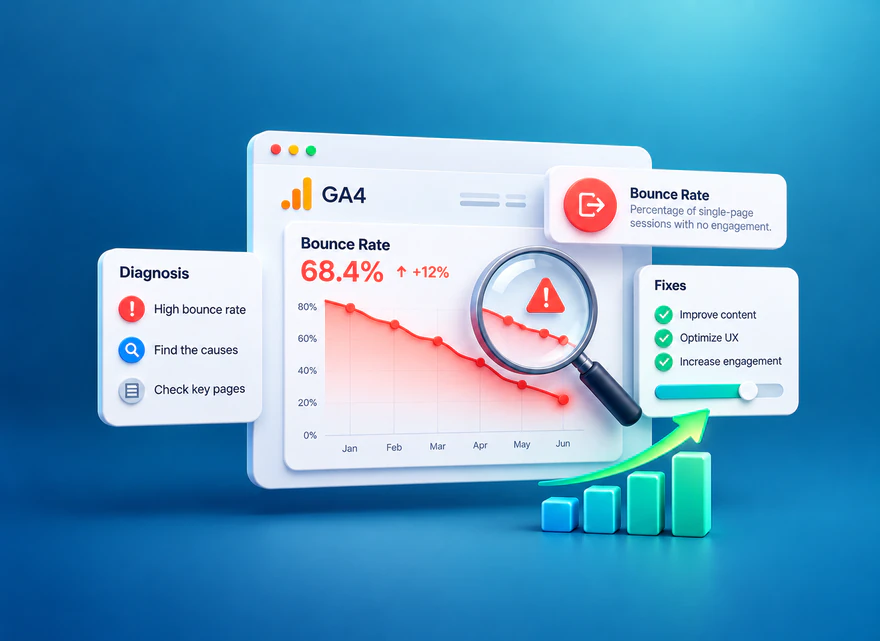
A complete guide to bounce rate: the GA4 definition and formula, what the metric can and cannot tell you about SEO, and a practical process for diagnosing and fixing landing-page engagement problems.
Bounce rate is the percentage of GA4 sessions that were not engaged. It helps you investigate what happens after a visitor lands on your website. It does not, by itself, tell you whether a reader was satisfied, whether a lead was valuable, or why a page moved in Google Search.
For SEO, the useful question is whether the page delivers what a relevant searcher expects. Confirm the measurement, isolate organic landing-page sessions, examine the page’s Query × Page evidence in Search Console, and test the specific obstacle you find. A visitor can get a complete answer and leave; another can spend a long time struggling with a form.
This guide combines the definition, calculation, common misconceptions, and a practical diagnosis-and-fix process. It uses GA4 for observed on-site activity and Search Console for Google Search visibility. Keep those forms of evidence separate, and evaluate meaningful actions rather than pursuing a lower percentage for its own sake.
What is bounce rate in GA4?
In Google Analytics 4, an engaged session lasts longer than the configured engagement threshold (10 seconds by default), has a key event, or has at least two page or screen views. Bounce rate is the percentage of sessions that were not engaged; it is the complement of engagement rate. This is not simply the percentage of people who view one page and leave. A single-page visit lasting long enough can count as engaged, while an unhelpful second page view can also satisfy the engagement definition.
In a hypothetical example, if a page starts 100 sessions and 62 are engaged under the property’s current settings, its bounce rate is 38%. That arithmetic says nothing by itself about whether visitors completed their goals. The result can change if key events are configured differently, so review what is marked as a key event before interpreting a trend. A page-view event incorrectly marked as a key event could make engagement appear stronger without making the experience better.
Formula: Bounce rate = (non-engaged sessions ÷ total sessions) × 100. Equivalently, it is 100% minus engagement rate for the same segment and period. In the example above, 38 non-engaged sessions out of 100 produce a 38% bounce rate and a 62% engagement rate. Count sessions rather than distinct people: one person may begin several sessions.
The engagement timer can be adjusted in the web stream’s Google tag settings. Record the threshold and relevant key-event settings when you establish a baseline. A comparison across a tracking change may be a comparison of definitions rather than behavior. An ordinary click or scroll is not automatically a key event and does not necessarily make a short session engaged.
GA4 works with sessions and your site’s measurement setup. Search Console works with Google Search impressions and clicks. They do not use the same population, counting method, or reporting clock, so a GSC click total should not be expected to equal GA4 organic-search sessions. Use the two products for complementary questions rather than merging their raw totals.
Bounce, exit, abandonment, and returning to search are different
Older articles often describe a bounce as a single-page visit. That shorthand reflects older analytics approaches and is inadequate for GA4. Someone who reads one article for several minutes may be engaged without opening a second page. Someone who visits two pages but cannot finish the intended task can also count as engaged.
An exit identifies where a measured visit ends; it does not establish that the session was unengaged. Funnel abandonment concerns a defined action sequence, such as starting but not completing a checkout. Returning to Google to choose another result is a different behavior again. GA4 bounce rate does not reveal where a person went after leaving, so it cannot be used as a direct measure of a return-to-search pattern.
Choose the metric for the decision. Use bounce and engagement to investigate session behavior, a funnel to investigate steps in a task, and qualified actions to assess whether the page served its purpose. Avoid substituting one label for another or comparing a legacy single-page percentage directly with GA4’s current metric.
Does bounce rate affect SEO rankings?
Your GA4 bounce-rate figure is not an established direct Google ranking factor, and there is no documented bounce-rate threshold that guarantees a better position. Google’s published explanation about Analytics and ranking said Analytics data was not used for ranking. That historical statement should not be stretched into a claim about every signal in every current search system.
The practical distinction remains useful: an analytics metric describes activity your implementation measured; a search ranking is an outcome of search systems. Fixing a broken mobile page or an incomplete answer may help visitors and address a real SEO weakness. It does not establish that a lower bounce percentage caused the improvement. Google also explains that good page experience and Core Web Vitals do not guarantee top rankings.
Do not replace one unsupported claim with another by calling bounce a powerful indirect ranking signal. Describe the actual problem, such as missing content, poor responsiveness, or misleading expectations, and verify its effect on visitors. Evaluate organic impressions, relevant clicks, and meaningful outcomes separately.
How to diagnose an organic landing page
Use GA4’s Landing page report to focus on the first page of a session. Choose one landing page and a meaningful date comparison, ideally two equal-length periods with the same weekdays. In a landing-page report or exploration, filter to the Organic Search session channel. Use Session source / medium = google / organic when investigating Google Search specifically.
Review sessions, engagement rate or bounce rate, average engagement time, and the key event that reflects the page’s purpose. If bounce rate is not visible in the report, an editor can add the metric. Segment by device and country when those differences are relevant. Confirm the landing-page path is the same on both dates.
In Search Console’s Performance report, filter to the exact page and inspect its queries, clicks, impressions, click-through rate, and average position. Compare the same periods and, when appropriate, devices and countries. The page filter is essential: a query that sends traffic elsewhere on the site does not explain this landing page. Export or record the leading relevant Query × Page rows, and note whether the mix shifted from specific, high-intent terms to broad informational terms.
Query × Page is an aggregate review, not a way to identify the exact query used by every GA4 visitor. Search Console hides some queries for privacy and limits the rows it reports, as its query-report documentation explains. Do not assign a bounce percentage to an individual search term merely because the term appears in the page’s GSC table.
Then ask what the query promises and what the page delivers. Does the first screen answer the main question? Does a product query land on a generic article instead of a product page? Are title and snippet expectations consistent with the content? Could mobile layout, intrusive overlays, or slow rendering interrupt the experience? These are hypotheses to verify, not automatic deductions from a bounce percentage.
If a page is meant to answer a concise informational query, a single satisfying visit with no lead may still be a success. Define a suitable secondary action—such as a relevant internal link click or a helpful resource download—only when it genuinely reflects reader progress. Do not add meaningless clicks just to lower a dashboard metric.
Use a worksheet to choose the next investigation
Prioritize an investigation by its likely effect on the visitor’s task, the strength of the evidence, and the effort required to verify it. A reproducible broken form deserves attention before a small percentage fluctuation with no clear behavioral change. Assign one owner and a review date so the observation becomes a decision rather than another dashboard entry.
Use a small worksheet to keep evidence separate. Record the query, landing page, GSC observation, GA4 organic segment, plausible issue, test, and review date. For example, if GSC shows stable impressions but fewer clicks for a query while GA4 organic engagement on the page is unchanged, the first investigation might be the search snippet or result layout—not the page’s bounce rate. If clicks are stable but key events fall, inspect the landing-page experience and conversion path.
| Observation | Next check | Potential action | Evidence of improvement |
|---|---|---|---|
| Organic landing-page bounce rises | GA4 device, country, key-event configuration and landing-page mix | Fix a verified page or tracking issue | Comparable organic segment and valuable actions, not bounce alone |
| GSC impressions stable, CTR falls | Query × Page position and search-result presentation | Clarify title/snippet and page promise if mismatched | Relevant clicks and queries in comparable periods |
| GSC clicks steady, leads fall | GA4 landing-page key events and form or checkout function | Repair the conversion path or offer explanation | Qualified actions per organic session |
| Mobile engagement weak, desktop stable | Page rendering, layout and interaction on mobile | Fix the observed usability defect | Mobile organic actions and engagement after rollout |
These rows are diagnostic routes, not promises. Keep the outcome metric tied to the visitor’s task. If the page is informational, evaluate answer completeness and the usefulness of onward paths. If it is transactional, a qualified lead or completed purchase may matter more than the session’s engagement label.

Start with one row you can verify. If the only evidence is a percentage movement on a small number of sessions, gather more context before committing to a large rewrite. Preserve the original report filters and review date so a teammate can repeat the investigation.
A hypothetical Query × Page review
Hypothetical example—not observed site data: A laptop-bag guide is visible in GSC for “best laptop bag for commuting” and “laptop bag dimensions.” During one four-week period, the page receives 300 Google Search clicks across its queries. GA4 records 265 Organic Search landing-page sessions, 130 engaged sessions, and 12 clicks to relevant product pages. The click and session totals differ; neither tool is necessarily wrong.
In the next equal-length period, GSC clicks remain similar, but the query mix shifts toward “laptop bag dimensions.” GA4’s organic bounce rate rises while product-page clicks fall. It would be premature to call this an SEO penalty. The new query may be answered quickly by one sizing paragraph, while the page’s primary next step points to a broad catalog. The team checks mobile behavior and event settings, then adds a clearer dimensions answer and a contextually relevant link to size-filtered products. It does not create a forced second page view.
The baseline bounce calculation is (265 − 130) ÷ 265 × 100, or approximately 51%. This is a hypothetical result for that defined segment, not a suggested target for other sites. The 12 product-link clicks are an observed action count in the scenario; they should not be relabeled as 12 buyers or 12 qualified sessions without verifying the event and its counting scope.
After publishing, the team compares Query × Page rows and the same GA4 organic segment again. It looks for relevant query coverage, helpful onward actions, and qualified product exploration. No ranking, traffic, or conversion result is assumed in advance. If the page’s purpose is just to answer sizing questions, a higher bounce rate with strong answer quality might be acceptable.
When a high bounce rate deserves attention
A sudden change confined to one page after a redesign, an increase among mobile users, or a simultaneous drop in qualified actions is worth investigating. So is a page that promises a specific answer in the search result but hides that answer under a long introduction. Check whether the page loads correctly, presents the expected content, and offers an appropriate next step. Inspect the raw experience before rewriting the whole article.
Long blocks of text, poor heading hierarchy, weak contrast, intrusive banners, or a broken form can create friction. Address the verified obstacle. If loading and responsiveness are a suspected cause, use the separate Core Web Vitals troubleshooting guide to measure LCP, INP, and CLS. Improving a real usability issue is valuable even if the bounce percentage barely moves.
Also consider measurement faults: duplicate page views, missing consent signals, a changed key-event definition, cross-domain session breaks, or referral exclusions can distort comparisons. Annotate tracking changes. Do not compare two periods as if the underlying GA4 setup were identical when it was not.
Fix the verified obstacle, then check the whole task
A diagnosis becomes useful when it leads to a specific change. Keep the change narrow enough to review, but complete enough to solve the visitor’s problem. Record the owner, affected page, evidence, proposed fix, and the metric that will help you decide whether to keep it.
Match the answer and next step to the query
For a product-size question, show dimensions, compatibility, and a readable size chart near the answer. For a service-eligibility question, explain the covered regions and relevant conditions before the form. Align the title and opening with what the page actually provides. A more attractive title that overpromises can increase clicks while worsening the visitor’s experience.
Place internal links where they help a reader continue a real task. A dimensions article may link to compatible products; a troubleshooting article may link to the next diagnostic step. Do not split a complete answer across pages or create irrelevant buttons to force an extra page view. The extra view can change the metric without improving the outcome.
Remove access, performance, and readability barriers
Test the landing URL and its important actions. A broken link may lead to a missing page; a slow-rendering interface is a separate technical problem. Verify the actual response and behavior rather than treating every loading defect as a 404. Check whether overlays obscure the answer, whether text remains readable, and whether keyboard and touch users can reach the relevant control.
When performance is implicated, identify the cause with field data and a repeatable lab investigation before choosing a fix. Reserve image space, avoid unnecessary scripts, and investigate slow interactions where the evidence supports those actions. A blanket promise that each speed improvement immediately lowers bounce or raises rank is unwarranted.
Make the valuable action work
Complete a test form or purchase path using an appropriate test setup. Check validation, confirmation, duplicate submissions, and analytics events. A button click is weaker evidence than a successful submission, and a submission is weaker evidence than a qualified lead. Choose the closest reliable measure of the page’s intended outcome.
For an informational page, improve answer clarity and optional onward paths while respecting a reader who needs only the answer. For a commercial page, make pricing, suitability, support, and terms easy to understand. Keep the visitor’s decision central instead of extending time on page artificially.
After the fix, repeat the original task and confirm that its measurement still works. A page that becomes easier to use may shorten a successful visit. Treat that as a possible improvement when the meaningful outcome supports it, even if average engagement time falls.
What is a good bounce rate?
A useful benchmark is your own comparable page set, purpose, device, and period—not a fixed range for every blog, shop, and service site. An answer page and a checkout page have different expected behaviors. A page with a high bounce rate and strong qualified outcomes may be doing its job. A page with a low bounce rate caused by accidental extra views may be performing poorly.
Use the metric as one clue among several: organic landing-page sessions, engaged sessions, key events, relevant GSC queries, and user-observed friction. Choose the next experiment from the combined evidence. A clear page-level hypothesis might be, “Mobile visitors searching for bag dimensions cannot find the size chart before the product CTA.” That is testable; “reduce bounce to 40%” is merely a target number.
Review changes without inventing a result
Write down the publication date, the hypothesis, and the expected evidence before reviewing performance. Compare periods of suitable length, the same landing page, and the same acquisition segment. Record tracking changes, device mix, seasonal demand, and major site changes that might offer another explanation. Small samples can produce large percentage swings; present the session counts alongside the rate.
When possible, use a properly designed test for a focused page change. Otherwise, call the comparison observational. Stable clicks with better qualified actions can support keeping a usability fix; a bounce reduction without improved task completion may require another investigation. Avoid claiming that one edit caused every later movement in traffic or rankings.
A useful review ends with a decision: retain the fix, revise the hypothesis, repair measurement, or gather more evidence. The report should explain what was observed and what remains uncertain. It should never promise an index, ranking, lead, or sale from a metric change.

Increase Website Traffic
Buy website traffic for your improved page. Choose your audience and track engagement with Seovisitor.
Keep paid campaigns out of the organic diagnosis
A paid or purchased website-traffic campaign is a separate acquisition source. It may send visits to a landing page, but its audience, intent, and campaign setup differ from unpaid Google Search. Combining those sessions with Organic Search can hide the very issue you are investigating. Tag and review such campaigns separately, and assess their cost and valuable actions on their own terms.
Do not buy visits to manufacture a lower bounce rate or infer an SEO benefit from a changed GA4 chart. A paid campaign cannot repair a misleading snippet, missing answer, slow page, or broken form. Once the page’s organic experience has been reviewed, a separate campaign may be evaluated as paid distribution—but never as evidence that Google’s ranking system rewarded a bounce-rate change.
The practical goal is to understand whether the right searcher reaches the right page and completes a meaningful task. Confirm the definition, validate the data, investigate the query and page together, and fix the obstacle you can demonstrate. Use bounce rate as a clue within that process, with the page’s purpose and useful outcomes providing the context.
Frequently Asked Questions
Quick answers to common questions about bounce rate and SEO
They count different things under different rules. Search Console reports Google Search clicks; GA4 reports measured website sessions subject to consent, tracking, and session definitions. Use the reports together without expecting their totals to match.
Bounce rate is the percentage of sessions that were not engaged. An engaged session exceeds the configured time threshold (10 seconds by default), includes a key event, or has at least two page or screen views.
Yes. A single-page session can be engaged when it lasts longer than the configured engagement threshold or includes a key event. Viewing only one page is not enough to classify a GA4 session as a bounce.
A lower GA4 bounce-rate figure does not establish a ranking improvement. Use it to investigate the page experience, and review relevant Search Console impressions, clicks, and meaningful on-site outcomes separately.
There is no universal percentage for every website. Compare the same page purpose, acquisition segment, device, tracking settings, and period; assess valuable actions alongside the rate.
No. Search Console reports Google Search activity, while GA4 measures on-site sessions. Review Query × Page data alongside the page's organic landing-page segment, but do not assign individual query bounce rates from those aggregate reports.
A GA4 bounce is a non-engaged session. An exit concerns where measured activity ends. A visitor can leave after an engaged session, so leaving the website does not necessarily mean a bounce.
Changes to the engagement threshold, key events, page-view collection, consent setup, or session attribution can alter the metric. Validate and annotate measurement changes before interpreting the difference as changed visitor behavior.
Purchased visits are a separate acquisition campaign. They cannot repair a missing answer, broken form, or technical defect, and changing a blended analytics percentage does not demonstrate an organic-search benefit.


Comments
Leave a Comment