How to Use Microsoft Clarity Heatmaps to Improve SEO Performance
In modern SEO, understanding how users interact with your website is just as important as ranking in search engines. One of the most powerful tools for this purpose is Microsoft Clarity, a free analytics platform that provides deep insights into user behavior.
By using Microsoft Clarity Heatmaps, website owners can visually see how visitors engage with different parts of a page, including where they click, how far they scroll, and what areas capture the most attention. This level of behavioral data goes beyond traditional analytics and helps uncover real user intent.
Analyzing user behavior is essential for improving SEO performance. When you understand how users interact with your content, you can optimize page structure, improve engagement, and reduce bounce rates. These improvements directly influence search engine rankings.
In this article, we will explore how Microsoft Clarity Heatmaps can help you make data-driven decisions that enhance user experience and ultimately improve your SEO performance.
What Are Microsoft Clarity Heatmaps?
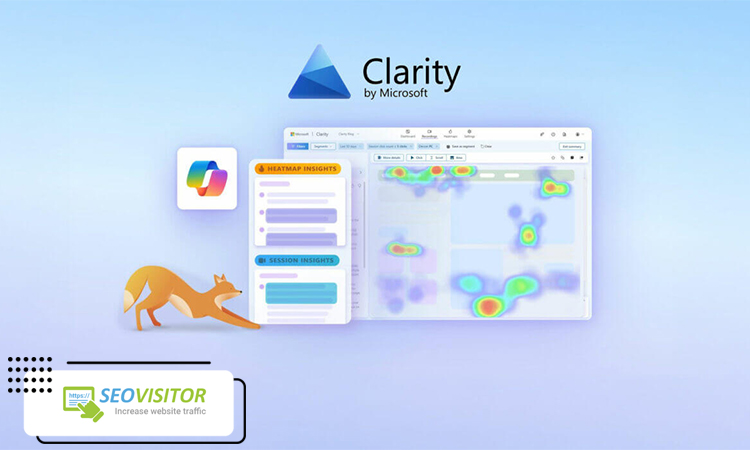
Microsoft Clarity Heatmaps are visual analytics tools that show how users interact with your website pages. Instead of looking at raw numbers and tables, heatmaps present user behavior in a color-coded format, making it easier to understand what attracts attention and what gets ignored.
In Microsoft Clarity, heatmaps are mainly divided into three types:
- Click Maps: These show where users are clicking on a page. They help identify which buttons, links, or elements get the most engagement—and which ones are being ignored.
- Scroll Maps: These illustrate how far users scroll down a page, helping you understand whether your content is being fully consumed or abandoned early.
- Attention Maps: These highlight the areas where users spend the most time, giving insight into what captures real interest.
Unlike Google Analytics, which focuses on numerical data like traffic sources and page views, Microsoft Clarity Heatmaps focus on visual behavior patterns. This makes it much easier to understand how users actually experience your website.
From a UX perspective, heatmaps play a crucial role in identifying friction points, improving layout structure, and optimizing content placement. This leads to better engagement and stronger SEO performance over time.
Ready to drive targeted engagement from the United States? Our premium solutions allow you to buy USA traffic that is reliable and effective. Reach out to our specialists now for a free consultation and discover the best strategy for your growth.
What Are Microsoft Clarity Heatmaps?
Microsoft Clarity Heatmaps are powerful visual analytics tools that help you understand how users interact with your website pages. Instead of relying only on raw numbers and tables, heatmaps transform user behavior into a color-coded visual format, making it easy to see what elements attract attention and what areas are ignored.
In Microsoft Clarity, heatmaps are mainly categorized into three types:
Click Maps: These show exactly where users click on a page. They help you identify which buttons, links, or interactive elements receive the most engagement and which ones are overlooked.
Scroll Maps: These illustrate how far users scroll down a page. This helps you determine whether visitors are consuming your full content or dropping off early.
Attention Maps: These highlight the areas where users spend the most time, giving deeper insight into what captures their interest.
Unlike Google Analytics, which primarily focuses on numerical data such as traffic sources and page views, Microsoft Clarity Heatmaps provide visual behavior insights that make user interaction much easier to understand.
From a UX perspective, heatmaps are essential for identifying friction points, improving page layout, and optimizing content placement, ultimately leading to better engagement and stronger SEO performance.
How to Set Up Microsoft Clarity Heatmaps
Setting up Microsoft Clarity Heatmaps is a straightforward process, and it only takes a few minutes to start collecting valuable user behavior data.
- Create a Microsoft Clarity Account
First, go to the Microsoft Clarity website and sign up using your Microsoft, Google, or Facebook account. After logging in, you can create a new project for your website. - Install the Tracking Code
Once your project is created, Clarity will provide a unique tracking script. This code must be added to your website’s header section so it can start recording user interactions. - Connect to WordPress or CMS
If you are using WordPress or another CMS, you can install Clarity easily using plugins or by manually inserting the tracking code into your theme settings. Many SEO plugins also support integration. - Start Data Collection
After installation, Microsoft Clarity automatically begins tracking user behavior. It collects data such as clicks, scrolls, and session activity without affecting website performance. - Review Initial Heatmaps
Within a few hours or days, you can start exploring Microsoft Clarity Heatmaps to understand how users interact with your pages and identify early optimization opportunities.
This setup process lays the foundation for improving UX and SEO performance through real behavioral insights.
How to Analyze User Behavior Using Heatmaps
Once your data starts flowing in, Microsoft Clarity Heatmaps become a powerful tool for understanding real user behavior on your website. The key is not just viewing the data, but interpreting it correctly to make meaningful improvements.
Identify key click areas
Start by analyzing where users are clicking the most. These hotspots show which elements are attracting attention and performing well. If important buttons or links are not receiving clicks, it may indicate poor visibility or weak placement.
Detect ignored sections
Heatmaps also reveal parts of your page that users completely ignore. These “cold zones” often indicate irrelevant content, poor design hierarchy, or lack of visual emphasis.
Analyze scroll behavior
Scroll maps help you understand how far users go down a page. If most visitors drop off early, it may suggest that your content is too long, unengaging, or not structured properly.
Find weak CTAs
Call-to-action buttons are critical for conversions. If users are not interacting with them, you may need to improve positioning, wording, or design.
Understand user journey flow
By combining click and attention data, you can better understand how users move through your page, helping you optimize navigation and content structure.
Using these insights from Microsoft Clarity Heatmaps, you can make data-driven improvements that enhance both user experience and SEO performance.
Using Microsoft Clarity Heatmaps to Improve SEO Performance
One of the biggest advantages of Microsoft Clarity Heatmaps is their ability to turn user behavior into actionable SEO improvements. Instead of guessing what works on a page, you can rely on real interaction data to optimize performance.
Optimize content based on user behavior
Heatmaps show which parts of your content attract attention and which sections are ignored. This helps you restructure or rewrite content to better match user intent and improve engagement signals that influence SEO.
Improve landing page structure
By analyzing scroll and click patterns, you can identify whether your landing page layout is effective. Pages that fail to guide users properly can be reorganized to create a smoother reading and navigation experience.
Enhance CTA placement
If users are not clicking your call-to-action buttons, Microsoft Clarity Heatmaps can help you determine better positions, visibility, and design adjustments to increase conversions.
Increase internal click-through rates
Understanding where users click allows you to improve internal linking strategies, encouraging deeper site exploration and improving overall SEO performance.
Reduce low-engagement sections
Heatmaps highlight areas that users consistently ignore. Removing, shortening, or improving these sections helps increase content quality and user satisfaction.
Common Mistakes When Using Microsoft Clarity Heatmaps
While Microsoft Clarity Heatmaps provide powerful insights into user behavior, many businesses fail to use them correctly, which can lead to poor decisions and missed SEO opportunities.
Misinterpreting data
One of the most common mistakes is drawing incorrect conclusions from heatmap visuals. For example, a high-click area does not always mean positive engagement—it can sometimes indicate user confusion or misclicks.
Focusing only on clicks
Many users only analyze click maps and ignore other important data. However, scroll depth and attention maps are equally important for understanding full-page engagement.
Ignoring scroll depth insights
Not analyzing how far users scroll can lead to incomplete optimization. If users never reach key content or CTAs, rankings and conversions may suffer.
Not combining with other SEO tools
Relying solely on Microsoft Clarity Heatmaps without integrating tools like Google Search Console or Analytics limits your understanding of both traffic and behavior data.
Making changes without A/B testing
Implementing changes based on assumptions without testing can negatively impact performance. A/B testing ensures that optimizations actually improve results.
Avoiding these mistakes helps you get the most value from Microsoft Clarity Heatmaps and make smarter SEO-driven decisions.
Advanced Tips for Better SEO Insights
To get the most out of Microsoft Clarity Heatmaps, you need to go beyond basic analysis and combine multiple data sources and techniques for deeper SEO insights.
Combine Clarity with Google Search Console
One of the most effective strategies is integrating Microsoft Clarity Heatmaps with Google Search Console data. While Search Console shows how users find your pages, Clarity reveals how they interact with them. Together, they provide a complete SEO performance picture.
Use Heatmaps with Session Recordings
Heatmaps show patterns, but session recordings show individual user behavior. Combining both helps you understand not just what users do, but why they do it.
Analyze pages with low CTR
Identify pages that receive impressions but low click-through rates. Heatmaps can help reveal whether poor layout, weak CTAs, or unclear structure is causing the issue.
Optimize UX based on real behavior data
Instead of guessing, use actual user interaction data to improve navigation, content structure, and readability. This leads to stronger engagement signals for SEO.
Test changes before final implementation
Always validate improvements using A/B testing or controlled experiments to ensure that changes positively impact performance.
Real Use Cases of Microsoft Clarity Heatmaps
Microsoft Clarity Heatmaps can be applied across different types of pages to improve both user experience and SEO performance in practical, measurable ways.
Optimize blog pages
Heatmaps help identify which parts of your articles are being read and which sections are ignored. This allows you to restructure content, improve readability, and place important information in more visible areas.
Improve product pages
By analyzing click and scroll behavior, you can determine whether users are engaging with product images, descriptions, and purchase buttons. This helps optimize layout and increase engagement.
Increase conversion rates on landing pages
Heatmaps reveal whether users are interacting with your call-to-action elements. Based on this data, you can adjust placement, design, and messaging to improve conversions.
Reduce bounce rate
If users are leaving pages too early, scroll maps can help identify where engagement drops, allowing you to improve content structure and keep users on the page longer.
Boost content engagement
Understanding what captures attention helps you refine headings, visuals, and internal links to increase overall interaction with your content.
Conclusion
In conclusion, Microsoft Clarity Heatmaps are a powerful tool for understanding real user behavior and improving SEO performance. They provide visual insights that go beyond traditional analytics, helping you identify what works and what doesn’t on your website.
In modern SEO, success is no longer just about keywords—it is about user experience. This is why Microsoft Clarity Heatmaps play a crucial role in optimizing pages based on actual behavior data.
When you combine UX insights with data-driven decisions, you create a stronger and more effective SEO strategy. In simple terms, better user experience leads to better rankings.
Ultimately, the formula is clear: UX + data = sustainable organic growth.
If you want to improve engagement, reduce bounce rates, and boost SEO performance, start using Microsoft Clarity on your website today and turn user behavior into actionable growth insights

Lasted Comments (0)