


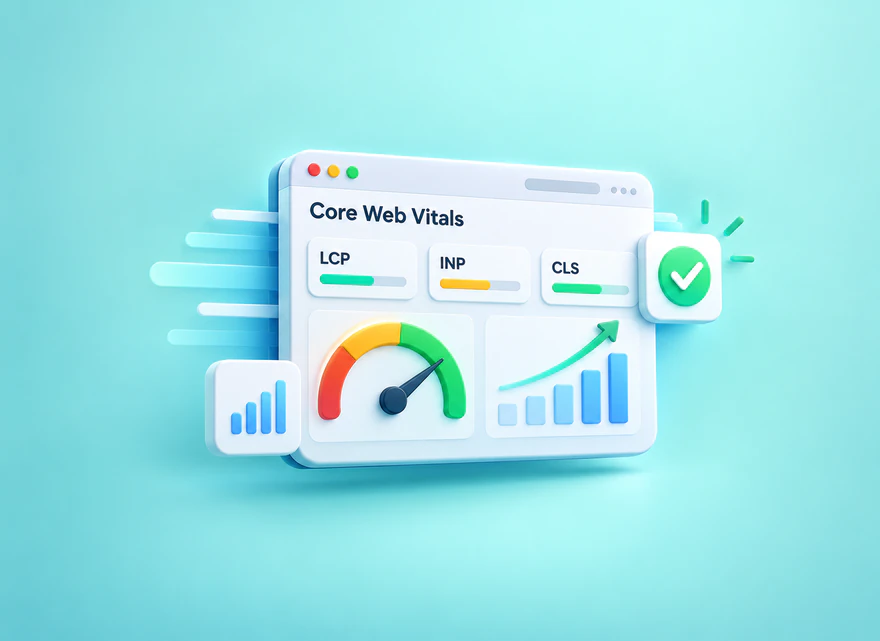
Understand LCP, INP and CLS, then use real-user data and controlled tests to diagnose loading, responsiveness and layout problems, prioritize fixes, and verify the deployed result.
Core Web Vitals are three measures of how a web page feels to real visitors: how quickly its main content appears, how promptly it responds to interaction, and how stable its layout remains. The current metrics are Largest Contentful Paint (LCP), Interaction to Next Paint (INP), and Cumulative Layout Shift (CLS).
To improve them, first identify the affected page and device in real-user data. Then reproduce the problem in a controlled test, trace its cause, change the relevant code or asset, and verify the result. A performance score alone does not tell you what to fix, and buying visits does not repair a slow or unstable page.
This guide combines the definitions with a practical measurement and troubleshooting workflow. It explains which tools answer which questions, how to prioritize work across a site, and how to distinguish a successful technical fix from a claim about rankings or business results.
What Core Web Vitals measure
Each metric describes a different part of the experience. A page can show its main content quickly yet respond slowly to a filter, or respond promptly while a late-loading widget moves the button a visitor is trying to press. Treat these as separate problems rather than as one generic speed issue.
LCP: when the main visible content appears
Largest Contentful Paint measures the time until the largest eligible image, video poster, or text block visible in the viewport is rendered. It is not the time until every resource finishes downloading. On a product page, the main product image might be the LCP element; on an article, it might be the opening text or a large header image.
Identify the actual element before optimizing. Compressing a footer image will not address a delayed product hero, and improving server response may not be enough if JavaScript keeps that hero hidden.
INP: how promptly the page responds
Interaction to Next Paint assesses responsiveness to qualifying clicks, taps, and keyboard interactions during a visit. It includes waiting for the browser to handle the input, running the relevant work, and presenting the next visual update. An unresponsive menu or a slow product filter can therefore matter even after the initial page load looks complete.
INP replaced First Input Delay (FID) as a Core Web Vital in March 2024. FID focused on the delay before processing the first interaction; INP covers a broader interaction experience. Old FID thresholds should not be used to assess current INP performance.
CLS: whether the layout stays predictable
Cumulative Layout Shift measures unexpected layout movement using a unitless score. Examples include a review panel pushing product details downward or an image appearing without reserved space. Not all movement is a problem: the metric distinguishes unexpected shifts from changes associated with recent user input.
A low score does not mean the page must never change. It means visitors should be able to read, select, and act without content unexpectedly moving underneath them. Google’s Core Web Vitals overview explains the current metrics and their assessment model.
Current thresholds and how to interpret them
The following thresholds apply to each metric. For a good Core Web Vitals assessment, all three need to meet the good threshold at the 75th percentile, with mobile and desktop assessed separately. This is a distribution of experiences, not simply an average of a few tests.
| Metric | Good | Needs improvement | Poor |
|---|---|---|---|
| LCP | 2.5 seconds or less | Over 2.5 to 4 seconds | Over 4 seconds |
| INP | 200 milliseconds or less | Over 200 to 500 milliseconds | Over 500 milliseconds |
| CLS | 0.1 or less | Over 0.1 to 0.25 | Over 0.25 |
For a hypothetical illustration, a mobile LCP of 2.4 seconds at the 75th percentile means approximately three quarters of the measured experiences are at or below that value. It does not establish that every visitor had a fast experience, or that INP and CLS were also good.
Search Console can group similar URLs, and its group status reflects the worst-performing assessed metric. Before changing a template, inspect the affected group, sample pages, and device category. The official Core Web Vitals report documentation describes the thresholds and grouping limitations.
Core Web Vitals, page experience, and SEO
Google says that Core Web Vitals are used by its ranking systems, but good scores do not guarantee high rankings. A technically fast page still needs useful, relevant content. Conversely, a ranking change after a performance deployment does not establish that the deployment caused it.
Keep four questions separate: can the page be accessed and indexed, does it answer the searcher’s need, is its experience usable, and does it support a valuable action? Core Web Vitals address part of the experience question. They are not a complete accessibility audit, a content-quality grade, or a conversion measure.
HTTPS, sensible mobile layouts, and non-obstructive interfaces remain important considerations, but they are not additional LCP, INP, or CLS metrics. Read Google’s guidance on Core Web Vitals and search and page experience before presenting a technical improvement as an SEO promise.
Field data versus lab data: start with the right evidence
Field data describes experiences from real users over time. Lab data comes from a controlled test with particular settings. Both are valuable, but they answer different questions: field data helps establish whether visitors have a problem, while a lab trace helps explain how that problem happens.
Use real-user data to locate the problem
Search Console’s Core Web Vitals report uses Chrome UX Report (CrUX) data for groups of URLs. PageSpeed Insights can show CrUX data for the tested URL or, when appropriate, its origin. Always read the scope label: an origin-level assessment is not a measurement of that individual page alone.
CrUX reporting uses a rolling 28-day period. Results reflect eligible observations, not every visitor to the site. A page with insufficient data may have no URL-level assessment. That absence is a measurement limitation, not evidence that the page is either fast or slow.
Use controlled tests to explain the cause
A Lighthouse run can expose loading opportunities, but its performance score is not the same as passing the field Core Web Vitals assessment. Standard Lighthouse loading tests also do not reproduce all the interactions and later layout changes of a real visit.
Record a relevant journey in Chrome DevTools: open the page, use its menu or filters, scroll to dynamically loaded content, and complete a safe test interaction. Choose conditions that resemble the affected visitors. Repeat comparable tests rather than treating one unusually fast or slow run as definitive.
Differences between lab and field results are expected because devices, networks, cache states, and visit behavior vary. The PageSpeed Insights documentation explains its two datasets; the guide to lab and field differences helps interpret disagreements.
Choose the tool for the next question
A useful investigation moves from the affected population to a representative page and then to a specific cause. Avoid collecting reports that cannot change the next decision. Save the URL, device, date, dataset, and test conditions alongside the result so a colleague can reproduce the investigation.
| Question | Tool | Useful output | Limitation |
|---|---|---|---|
| Which page groups need attention? | Search Console | Affected groups, device category, and metric | Grouped field data; not a cause trace |
| What does this URL’s assessment show? | PageSpeed Insights | Field scope plus lab diagnostics | URL data may be unavailable; origin fallback is broader |
| What delays or shifts this page? | Chrome DevTools Performance | Loading, interaction, and layout-shift evidence | A local recording is not the visitor population |
| Which real visits still have problems? | Own real-user monitoring | Performance by route, device, or release | Requires correct instrumentation and appropriate privacy controls |
Start with one representative URL, but test enough examples to establish whether the cause belongs to a shared template. A category page, product page, and editorial page may use different assets and scripts even when they share the same site header.
The former Web Vitals Chrome extension is no longer the recommended installation path. Its functionality was incorporated into the DevTools Performance panel. Use the current Performance documentation rather than instructions for the retired extension.
Diagnose and improve LCP
First locate the LCP element in a performance recording. Then follow its critical path: obtaining the initial document, discovering the relevant resource, transferring it, and finally rendering it. Google’s LCP optimization guide explains why reducing only file size may leave other delays untouched.
Check the document and resource discovery
If the initial response is slow, investigate the server, cache behavior, redirects, and the work needed to generate the document. A CDN or improved caching can help a verified delivery bottleneck; neither is a universal answer to every poor LCP result.
If the hero image is discovered late, check whether it is hidden behind JavaScript or incorrectly lazy-loaded. Do not lazy-load the actual above-the-fold LCP image. Make it discoverable early, and consider an appropriate priority hint only after confirming what the browser needs. Prioritizing every image defeats the purpose.

This chart describes the assessment boundaries, not a troubleshooting prescription. A delayed text block and a delayed product photograph can produce the same LCP classification while requiring different changes.
Check transfer and rendering
Serve an image suited to its displayed dimensions, use a suitable format, and avoid transferring an unnecessarily large original. Compare the resource timing before and after the change. For a text LCP element, investigate the resources needed to make that text visible rather than optimizing unrelated images.
If the resource arrives promptly but appears late, inspect blocking styles, scripts, visibility rules, and rendering work. Remove unnecessary work cautiously: deleting CSS or deferring JavaScript without testing can break the page. Confirm that the main content still appears correctly on representative screen sizes.
Diagnose and improve INP
Reproduce the interaction visitors struggle with, not just the page load. A product filter, navigation drawer, or form validation step may be the important case. Record what the visitor does and what visible response should follow, then inspect the main-thread work around that interaction.
Separate waiting time from event-handler work and the delay before the next paint. A busy main thread can postpone an otherwise simple click. An expensive handler can also finish its calculation yet leave substantial layout or rendering work before the interface visibly responds.
Possible fixes include reducing unnecessary JavaScript, limiting repeated calculations, avoiding excessive DOM updates, and breaking suitable work into smaller tasks. Provide a prompt visible response when a longer operation is necessary, without pretending the operation is complete before it is.
Total Blocking Time in Lighthouse can flag loading-time main-thread pressure, but it is not an INP measurement. Re-test the actual interactions after changing a script, including keyboard use and repeated actions. Follow the official INP troubleshooting guidance to connect a change to the responsible work.
Diagnose and improve CLS
Record the point at which the layout moves. The element highlighted as shifting is not necessarily the element that caused the shift: a newly inserted banner above it may be responsible. Investigate the surrounding layout, especially resources and widgets that arrive later.
Give images and video appropriate dimensions or an aspect ratio, reserve suitable space for embeds and review panels, and avoid inserting unexpected content above what the visitor is already reading. Check both narrow and wide layouts; a placeholder that works on desktop may collapse or grow unpredictably on a phone.

Font changes can also alter line breaks and element sizes. Test the loading behavior of the chosen fonts and a realistic fallback. Do not solve a shift by hiding essential content indefinitely or reserving a large empty region that makes the interface harder to use.
Inspect the page after load as well as during load. Scrolling, expanding a panel, or receiving third-party content can reveal a problem missed by a short loading test. The CLS optimization guide covers these common sources and why field and lab scores may differ.
A hypothetical product-page investigation
Consider a hypothetical store whose mobile product-page group needs improvement. This is an illustrative investigation, not a SEOVisitor case study or a promise of a particular result. The team selects a representative product page and records its initial load, product filtering, and review-panel behavior.
Before: three symptoms with different causes
The main product image is lazy-loaded even though it appears immediately in the viewport. A filter rebuilds a large set of page elements in one operation. Later, a review widget inserts a panel above the product description without reserved space. The team records these as separate LCP, responsiveness, and layout hypotheses rather than calling the whole page slow.
Before editing, it saves a baseline recording, notes the device and network settings, and checks another product using the same template. If that page behaves differently, the team investigates whether a specific asset, product configuration, or third-party component explains the difference.
After: changes that can be tested
The proposed revision makes the hero image discoverable without lazy loading, supplies an appropriately sized image, reduces the filter’s unnecessary rendering work, and gives the review panel a stable container. Each change has an owner and a verification step. The team does not claim an improved field score merely because the code has changed.
It repeats the same loading and interaction tests, checks that filtering and reviews still work, and then monitors fresh mobile field data for the affected template. If a delay remains, the next trace determines whether the original diagnosis was incomplete. No numerical improvement, extra sale, or ranking gain is assumed.
Troubleshooting worksheet: symptom to verification
Use this table to organize evidence and propose a next test. It is a hypothesis map, not an automatic diagnosis. Two pages with the same poor metric can have different root causes, so an action should follow a trace rather than a generic checklist.
| Symptom | Possible cause | Action to test | How to verify |
|---|---|---|---|
| LCP image appears late | Late discovery or unsuitable lazy loading | Expose the hero resource early; remove its lazy loading | Compare resource discovery and LCP in equivalent traces |
| Resource loads but content stays hidden | Script or style delays rendering | Remove the verified rendering dependency | Check when content becomes visible and that layout still works |
| Filter or menu feels unresponsive | Main-thread congestion or expensive handler | Reduce unnecessary work; split suitable tasks | Repeat the interaction and inspect input-to-paint timing |
| Details jump when a widget loads | Unreserved space or late insertion | Reserve responsive space or change placement | Record shift attribution during load and later use |
| Lab looks good but field remains poor | Different conditions, later interactions, or reporting window | Match affected devices and journeys; inspect data scope | Compare comparable tests and subsequent real-user observations |
For each confirmed issue, write down the affected template, supporting evidence, expected experience change, implementation owner, and review date. This prevents a team from treating a completed ticket as proof that visitors are no longer affected.

Increase Visits After Optimization
Buy website traffic after fixing page performance. Increase visits and track activity on your optimized page.
Prioritize fixes and verify the deployed result
Start with a verified problem affecting an important template and a meaningful number of users. Consider severity, reach, implementation effort, dependencies, and the risk of breaking essential behavior. A small shared-template fix may deserve attention before a complex change to a rarely visited page, but reach alone should not override a severe accessibility or functional problem.
Keep the baseline comparable. Record whether a test used mobile or desktop, the route and actions, cache conditions, and the release being tested. Make one interpretable change where practical, or document a bundle of changes clearly enough that a later regression can be investigated.
Before deployment, check main-content visibility, navigation, forms, consent behavior, and relevant third-party components. After deployment, repeat the original test and inspect representative pages using the same template. A faster result is not a successful fix if a required interaction no longer works.
Field reports will not instantly mirror a lab result because their rolling window includes earlier experiences. Monitor subsequent data for the same device and scope, annotate the deployment, and note other changes such as a redesign, new scripts, or a different visitor mix. If URL-level data is absent, retain the limitation in the report rather than presenting origin data as a page-specific success.
Measure business outcomes separately. GA4 engagement and useful actions can help evaluate the landing page, while Search Console queries and clicks describe search performance. Neither dataset should be used to invent a causal ranking claim from a performance improvement. For that separate investigation, see our guide to organic landing-page engagement below.
A practical definition of success
A useful Core Web Vitals project ends with evidence: the responsible bottleneck was identified, the fix preserved the page’s function, and comparable tests and subsequent field observations support the improvement. A green score is a useful assessment, not a substitute for those checks.
Keep the next action specific. If LCP remains slow, return to the resource and rendering path. If interactions still lag, record the problematic journey. If shifts persist, inspect the element causing the movement. Improve the experience visitors actually have rather than chasing a perfect score with changes that do not address their problem.
Frequently Asked Questions
Quick answers to common questions about Core Web Vitals
Largest Contentful Paint (LCP), Interaction to Next Paint (INP), and Cumulative Layout Shift (CLS). INP replaced the older FID metric.
Field data reflects real visitors across devices and conditions over time. A Lighthouse lab run is a controlled diagnostic test, so its conditions and interactions can differ.
No. Paid visits do not repair loading, responsiveness, or layout stability. Fix the page code and assets, then verify real-user performance.
Reproduce the original issue in a comparable lab test, confirm the page still works, then monitor fresh field data for the same page group and device.
Start with a verified issue affecting important page templates and many real users. Use the field metric and a trace to identify its cause before prioritizing a change.
Good values are LCP of 2.5 seconds or less, INP of 200 milliseconds or less, and CLS of 0.1 or less. Assess all three at the 75th percentile, separately for mobile and desktop.
Not necessarily. Lighthouse is a controlled lab test, while the Core Web Vitals assessment uses real-user data. A loading test does not reproduce every interaction or later layout shift.
There may be insufficient eligible CrUX observations for the URL. Check whether the report shows broader origin data; missing URL data does not prove that the page is fast or slow.
CrUX-based reports use a rolling 28-day window, which includes earlier visits. Re-test the deployed fix in comparable conditions and monitor subsequent field observations for the same device and scope.



Comments
Leave a Comment