What is Hotjar? How to use it?
Do you know what Hotjar is and how to use it? As a marketer, you spend a lot of time ensuring users engage with your content. When we manage an online store and work in web marketing, we must know users’ habits and visits to our website. But sometimes, knowing what actions visitors take on your website is complex. All this is to improve the user experience and understand their needs to provide the right content.
Some use Google Analytics for this, but this tool is not complete enough to do reports of this type. So how can we do this quickly and for free? In this article, we will discuss this issue.
What is Hotjar?
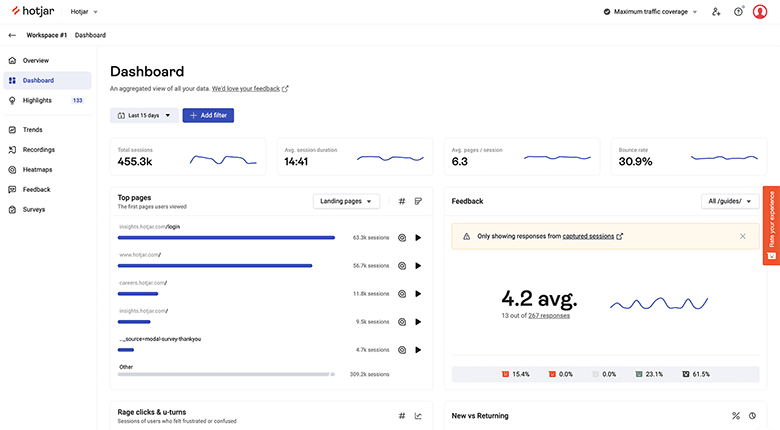
Hotjar is a tool that includes both analytics and user feedback collection. This tool helps you understand what visitors are doing on your website. Hotjar highlights combining various essential analytics functions with user feedback tools in a single platform.
Before Hotjar existed, we needed different platforms to access this combination of features, each of which increased the cost and complexity of your optimization toolbox. But Hotjar combines analytics, CRO, and user feedback functions in one platform (and at a relatively reasonable price).
We propose a data-driven approach to using Hotjar in a project to improve your website’s UX. From defining goals to making recommendations through tool configuration and analysis methods, this article will give you a clear vision of using this tool.
Allocate resources and set your goals in Hotjar.
First, determine what resources are available to conduct your study: teams, time, and type of Hotjar subscription. Explore where you want to enrich your understanding of user experience. Maybe you’re interested in their experience on your landing page or like to learn more about their engagement with a new call to action.
Now choose one of these points as the primary goal of the search. An acquisition channel can be a funnel, a conversion (micro or macro), or even a specific page. Focusing on one topic rather than trying to read the entire experience allows you to gain more detailed and actionable insights.
Then gather everything you already know about the UX of your website (data from, for example, your Google Analytics account, advertising agencies, or customer feedback collected through forms). Now it’s time to define a problem for your topic. For example:
- What problems do users face on the payment page?
- How do Facebook ads behave?
- What is the users’ response to the banner name of my newsletter?
Then ask yourself how you will implement the recommendations from Hotjer’s study, including changes to the website, available development resources, and deadlines. This point is crucial so your research has a tangible impact on the website experience beyond a diagnosis.
Configure the tool with Hotjar and create an analysis protocol
Now you need to select the parameters of your Hotjar records based on the defined criteria according to your problem and subscription type. For example, recording can start on certain pages, after events or conversions, or even after session duration. Also, consider not logging internal traffic with the IP address removal tool.
In the next Hotjar step, determine how many records you want to analyze based on the volume of sessions that meet your criteria, the amount of representation you want, and your analysis resources.
Next, choose how to analyze the recording in Hotjar. For this, specify the tags you will assign to them. These are keywords that you can associate with your recordings. They should reflect what users are searching for, their actions, their state of mind, and emotions you can infer (based on tangible criteria).
Run recordings and analyze them.
Now you can start recording. Your website traffic and Hotjar subscription determine the volume of recordings. If several people are responsible for analyzing recordings, create a protocol to interpret them uniformly. Arrange joint observation sessions to ensure this consistency.
If possible, select records that have a high relevance indicator. While watching, choose tags identifying user activity and take notes to collect quantitative and qualitative data. When a recording sounds unique and exciting, you can add it to your favorites. You can also copy the URL of some records and store them in an array according to the categories you define. Therefore, later when you present the results of your analysis, you can use the selected records as examples.
Make sure the sample capture you’re studying is representative of your overall traffic: Compare Hotjar data with Google Analytics data, specifically based on the following criteria:
- device type
- navigation system
- source/medium
- average session duration.
Export the data and read your results.
After reaching the desired volume of analyzed records, export the data from the logs to a spreadsheet through Hotjar. You can use several tools to analyze these results:
- Definition of a pivot table. For example, the volume of records by device type.
- The nb.if.ens function is defined to calculate the volume of records with multiple tags. For example, users who converted and whose session was fluid.
- Other analysis tools you think are relevant.
So it would help if you defined which combination of tags will provide you with rich information about the user experience, precisely your problem. Combining qualitative (your note-taking) and quantitative (tag analysis) data gives you a comprehensive view of the user experience on the website. Now you need to identify the most prominent points of friction.
Classify friction points based on their importance and connection to a website element (e.g., a CTA or a form). Then each of these points of friction with the numerical data obtained from your research or by observation (taking notes).
Use your analysis to create recommendations.
In this step of Hotjar, you can create recommendations or hypothetical solutions from your analysis to improve the user experience in this area. Several explanations can be categorized based on their simplicity and cost of implementation, as well as their estimated impact.
The advantage of the Hotjar solution is that you can collect a large number of records very quickly. So, at any time, you can adjust your recording parameters to handle better the behavior you’ve detected.
Provide your findings and recommendations.
To present your research findings and recommendations, be sure to consider the following elements for each point raised in Hotjar:
- Show the current state of the user experience with a screenshot or a recording extract, if possible.
- Numerical data and observations that define the user experience associated with the element you are studying.
- Your recommendations for development, the resources required, and the estimated impact of their implementation
- If possible, include an image of the proposed solution (this can be as simple as a drawing)
Present your results carefully so that the person deciding to implement your recommendations will understand what you are saying.
Remember that your audience probably has less understanding of the user journey than you do when presenting your results because you have spent time studying it through these recordings. So remember to put all the elements in your context: what page did the user come from, what is the intended function of this page, where is this action in the overall tunnel, is the user’s navigation as expected, or how is it different?
Test and repeat your assumptions with Hotjar
In some cases, such a study alone may be sufficient. You can also rely on other Hotjar tools, such as heatmaps or surveys, to enrich your analysis. Another option is contacting your users directly through interviews, focus groups, or questionnaires.
Once your recommendations are in place, you can test their performance with the same tool. Has your website’s user experience improved due to the changes? Otherwise, you need to create new recommendations or even reanalyze the records.
You can buy organic traffic to elevate search engine rankings like Google and increase website visitors.
Have you tried this method? If so, what did you think about it, and what were your results? If not, do you have another way to share?


Lasted Comments (0)